The AFSC completed the set of stock assessments for the Gulf of Alaska (GOA) and Bering Sea and Aleutian Islands (BSAI) Stock Assessment and Fishery Evaluation (SAFE) reports for 2015. These reports present analysis of the extensive data collected by NMFS-trained observers and AFSC scientists aboard dedicated research surveys. Observer data are used to estimate catch of target and prohibited species (e.g., salmon, crab, herring, and Pacific halibut) to ensure that fisheries do not exceed annually specified total allowable catches (TACs) or violate other fishery restrictions (like time-area closures). Results from the AFSC surveys, combined with observer data, are critical in conditioning statistical stock assessment models. Results from these models (and their estimates of uncertainty) are used to determine the status of individual species and make recommendations for future catch levels. This TAC-setting process involves annual presentations of these reports at a series of public meetings coordinated by the North Pacific Fishery Management Council’s (NPFMC) staff. These assessments were reviewed, compiled, and summarized by the Plan Teams for Council consideration in developing their recommended catch specifications for the 2015 and 2016 Alaska groundfish fisheries.
Research and data collection activities are fundamental to all the assessments and advice used by the Council. The Midwater Assessment Conservation Engineering (MACE) Program of the Center’s RACE Division conducted a survey in the GOA in the winter and in the summer covered the main area of the Bering Sea shelf. This survey covers the slope regions of the GOA along with segments of the Bering Sea and Aleutian Islands regions. During the summer of 2014 the groundfish assessment group conducted bottom-trawl surveys in the eastern Bering Sea (EBS) shelf area (376 stations) and the Aleutian Islands (410 stations). Additionally, this group continued collecting acoustic data when transiting between EBS trawl stations. The change in survey abundance estimates by species for the EBS and the Aleutian Islands indicate mostly increases relative to the previous survey estimates (Figs. 1 and 2). The AFSC’s Marine Ecology and Stock Assessment program runs the annual longline survey which is designed primarily for sablefish but also produces data used in Greenland turbot and some rockfish assessments (e.g., for the rougheye-blackspotted rockfish complex in the GOA; Fig. 3).
Figure 1. Relative change in the biomass estimates derived from eastern Bering Sea shelf trawl survey data between 2013 and 2014."Additional" strata 82 and 90 included (not used in all assessments). Invertebrates are excluded and sablefish, rockfish, Atka mackerel, and sharks included in total but omitted individually. FMP = Fishery Management Plan (species which are considered “in the fishery”).
Figure 2. Relative change in the biomass estimates derived from Aleutian Islands trawl survey data between 2012 and 2014. NOTE: Southern Bering Sea excluded and yellowfin sole, sharks, squids, and octopus included in total but not shown.
Figure 3. AFSC bottom trawl survey (top) and longline survey (bottom) with survey-derived estimates (open circles) with 95% sampling error confidence intervals for GOA RE/BS rockfish. Predicted estimates from the 2014 model results (dashed line) are compared with the 2011 model estimates (dotted blue line).
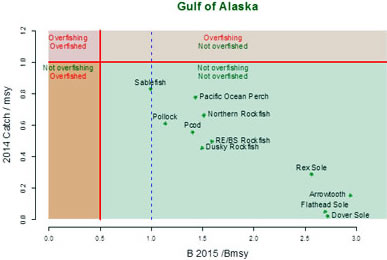
In the GOA, the projected 2015 spawning biomass estimates were estimated to be at or above the level expected to provide maximum sustained yield (MSY) in the long term (Fig. 4). This figure also indicates that the catches in 2014 were below levels associated with overfishing. For a number of the GOA stocks, e.g., rex sole, shortraker rockfish, other rockfish, demersal shelf rockfish, thornyhead rockfish, Atka mackerel, skates, sculpins, squid, octopus, and sharks, BMSY estimates are unavailable.
Overall, the trends resulted in increase in acceptable biological catch (ABC) by 7% compared to last year. This was due to projected increases in pollock (+17%), Pacific cod (+16 %), Pacific ocean perch (+9%), and shallow water flatfish (+8%). Notable declines were projected in demersal shelf rockfish (-18%), big skate (‑13%), rougheye and blackspotted rockfish (-10%), dusky rockfish (-7%), and northern rockfish (-6%).
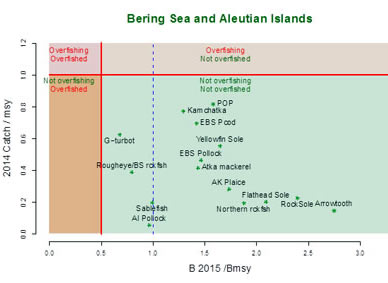
In the BSAI, the sum of the recommended ABCs for 2015 is 2.843 million metric tons (t), a 10% increase over the 2014 value. Most of the BSAI groundfish stocks continue to be above target spawning biomass levels and below fishing mortality rates that are estimated to achieve maximum sustainable yield. Presently four stocks are projected to be below BMSY in 2015: Aleutian Islands pollock, Greenland turbot, the rougheye and blackspotted rockfish (REBS) complex, and sablefish (Fig. 5).
The ecosystem considerations chapter (264 pages) of the SAFE report responded to 18 Scientific and Statistical Committee (SSC) comments and had over 100 contributions.In the Bering Sea, conditions warmed considerably relative to recent years. The summer acoustically-determined time series of euphausiids continues to decrease from its peak in 2009.
Survey biomass of pelagic foragers has increased steadily since 2009 and is currently above its 30-year mean. While this is primarily driven by the increase in walleye pollock from its historical low in the survey in 2009, it is also a result of increases in capelin from 2009-13, perhaps due to cold conditions prevalent in recent years. This report also details observations by Aleutian Islands ecoregions (Eastern, Central, and Western).
Fisheries for these groundfish species during 2013 landed 2.2 million t valued at approximately $1.9 billion after primary processing (Economic Chapter; 411 pages). This represents about 48% of the weight of all commercial fish species landed in the United States. The bulk of the landings are from eastern Bering Sea pollock (landings of about 1.3 million t).
Many of the flatfish stocks (e.g., rock sole, Alaska plaice, and arrowtooth flounder) remain at high abundance levels, but catches are relatively low. Yellowfin sole abundance is high but a larger fraction of the ABC is caught compared to other flatfish stocks in the eastern Bering Sea. Rockfish species comprise 5%-8% of the groundfish complex biomass and have generally been increasing based on recent surveys. The subsequent sections summarize groundfish conditions in each management area based on the SAFE report.
Figure 4. Catch relative to the catch at FMSY relative to the projected stock status (horizontal axis) of groundfish in the Gulf of Alaska .
Figure 5. Catch relative to the catch at FMSY relative to the projected stock status (horizontal axis) of groundfish in the Bering Sea and Aleutian Islands.