Cetacean Assessment & Ecology Program
Cook Inlet Beluga Calf Survey
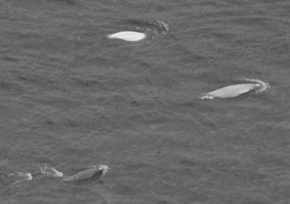
Figure 3. A digital still image of an adult (white), juvenile (light gray), and calf (dark gray)
taken during an aerial survey of belugas in Cook Inlet. Photo by Christy Sims.
|
|
NMFS has been conducting annual aerial surveys to study the abundance and distribution of beluga whales in Cook Inlet,
Alaska, each June or July since 1993. Late spring is an ideal time for conducting aerial surveys because of the relatively
calm weather and long daylight hours. However, because belugas are known to calve between March and September (peaking in
June and July), the annual abundance surveys may not accurately account for all calves of the year. Therefore, in order to
examine the reproductive capacity and overall health of the stock, scientists from NMML and the NMFS Alaska Regional Office
surveyed Cook Inlet 11-12 August 2005 with the intent to document the ratio of new calves (very small and dark, almost black)
to yearlings (small and a dark gray) and adults (white) (Fig. 3). By conducting a survey in August in addition to the annual June
survey, we assume that the data represent a period when most calves were born but before significant calf mortality has
taken place.
Survey procedures used in August were similar to methods used in the annual abundance surveys. Approximately 10 hours were flown in a
twin-engine, high-wing aircraft at an altitude of 244 m along tracklines 1.4 km offshore. Observers searched for whales on either
side of the aircraft; however, unlike the annual abundance surveys, there was no attempt to conduct independent searches, and effort
was focused solely on coastal areas where belugas were known to frequent.
After finding beluga groups, a series of aerial passes was made with observers counting surfacing whales while paired video and
digital still cameras captured images for analyses. The digital video camera was used to document beluga groups and to allow precise
documentation of whale counts as a function of viewing time recorded to 1/30 second. Counts from video will be used to determine
abundance estimates with appropriate application of correction factors. A digital still camera was paired with the video camera to
provide greater detail in detecting calves, which are darker than the adults and do not rise above the surface as much as white adults.
The sum of the aerial counts was 236 belugas for 11 August and 277 belugas for 12 August, numbers that represent a rough index of
abundance uncorrected for missed whales. These counts were higher than uncorrected estimates from June during the past 7 years.
Analysis of the video tapes and digital still images will determine whether or not the number of whales encountered in August was
actually higher than in June, and the images will help establish the proportion of calves to juvenile and adult whales.
By Kim Goetz, Christy Sims, and Dave Rugh
>>>continued
 |

|
JAS2005 quarterly sidebar
AFSC Quarterly
Research Reports July-Sept 2005
Contents
Feature
ABL Reports
FMA Reports
NMML Reports
RACE Reports
REFM Reports
Items
Quarterly Index
Quarterly Home
|
