Environmental Monitoring/Climatology: Auke Bay Annual Summary, 2009
Table 1. Monthly Auke Bay weather records
for 2008, 2009, and average (1963 to present).
Median Air Temperature
(°F)
2008
2009
Average
Jan
26.77
25.97
26.17
Feb
27.84
29.34
30.25
Mar
36.00
31.03
34.50
Apr
39.27
39.98
41.34
May
49.27
49.52
46.83
Jun
52.40
56.37
55.09
Jul
53.73
61.58
56.64
Aug
54.62
56.66
56.85
Sep
49.60
51.23
50.77
Oct
41.47
43.37
42.96
Nov
35.50
35.42
33.47
Dec
23.81
28.79
29.18
Precipitation (inches)
2008
2009
Average
Jan
4.70
9.65
4.86
Feb
3.87
2.87
3.81
Mar
3.25
2.93
3.38
Apr
4.85
2.21
2.92
May
2.53
3.26
3.81
Jun
2.67
2.61
4.08
Jul
8.28
2.69
5.47
Aug
5.58
9.16
6.55
Sep
12.29
7.64
9.05
Oct
11.65
6.70
8.60
Nov
4.70
5.88
5.37
Dec
4.43
3.58
5.10
Snowfall
(inches)
2008
2009
Average
Jan
23.80
72.4
28.39
Feb
38.61
21.1
17.56
Mar
12.31
19.2
11.72
Apr
9.70
3.00
2.21
May
0.00
0.00
0.00
Jun
0.00
0.00
0.00
Jul
0.00
0.00
0.00
Aug
0.00
0.00
0.00
Sep
0.00
0.00
0.01
Oct
3.30
0.00
0.67
Nov
2.60
11.80
12.29
Dec
28.60
8.20
19.25
Sea Surface Temperature
(°F)
2008
2009
Average
Jan
37.76
37.51
38.53
Feb
37.22
35.74
37.90
Mar
38.12
37.06
38.80
Apr
41.18
42.55
43.23
May
49.82
51.42
50.16
Jun
54.91
58.93
56.44
Jul
54.09
59.63
58.05
Aug
53.44
56.22
57.06
Sep
49.77
50.65
51.51
Oct
44.55
45.70
45.91
Nov
41.82
41.40
41.92
Dec
39.75
40.46
39.72
Following the dismal spring, summer, and fall of 2008, Auke Bay experienced a notably pleasant 2009. The 2009 summer's warm temperatures and low precipitation levels, although not exceptional were much more pleasant than that of 2008 (Table 1).
Above average air temperatures were experienced from late April through November. Much of this period was accompanied by lower than average precipitation and periods of high incoming solar radiation. Incoming solar radiation has a large impact on the local air and sea surface temperatures and personal perceptions of pleasant weather conditions.
Daily solar insolation may vary 4- to 5-fold within a 2-day period. Periods of high insolation are associated with high air temperature and high sea surface temperatures in late May, early June, early July and early August, much of September and even portions of October (Fig. 1 below).
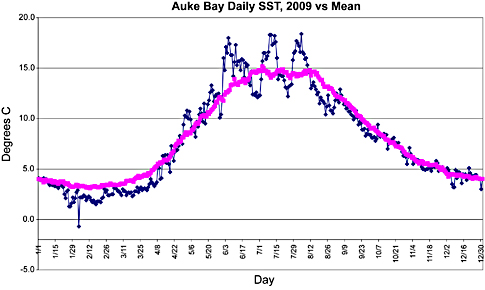
Sea surface temperatures (SSTs) (Fig. 1) at the Auke Bay Marine Station were below average through the winter and early spring (January April) then warmed to above average conditions in late May, June, and July. The remainder of the summer had below average SSTs, and the fall had near average SSTs.
Although climate models for the eastern Pacific Ocean project the current mild El Niño will last through late spring 2010, its effects have not extended much beyond southern California. The Gulf of Alaska has remained cool with only small patches of warmer than average surface waters.
Beginning in late November 2009, the Auke Bay Marine Station was able to download and archive incoming solar radiation data from the automated weather station at the end of the Auke Bay Marine Station pier.
The raw data can be obtained on the web through the U.S. Geological Survey (USGS) Emergency Distribution Net Work (EDDN) at http://eddn.usgs.gov/msgaccess.html. The EDDN provides access to a number of automated weather stations that report via environmental satellites to NOAA, the U.S. Geological Survey, and other science agencies. Unfortunately, the EDDN system only archives raw data for 6 months.
The Auke Bay Marine Station Data Collection reports hourly the status of its battery, air temperature, accumulated precipitation, barometric pressure, incident solar radiation, sea surface temperature, and tidal height.
We plan to download the Auke Bay Marine Station data weekly for studies related to eel grass growth.
By Bruce Wing
Figure 1. Comparison of 2009 Auke Bay sea surface temperatures to the mean.