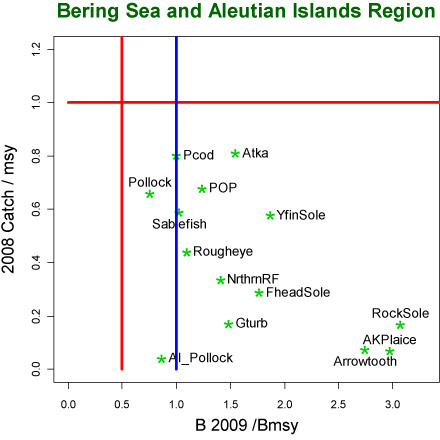
Figure 1. Relative 2009 spawning stock size compared to Bmsy (taken to be B35% for all species except EBS pollock) versus relative 2008 catch levels compared to 2008 Fmsy levels for BSAI stocks.
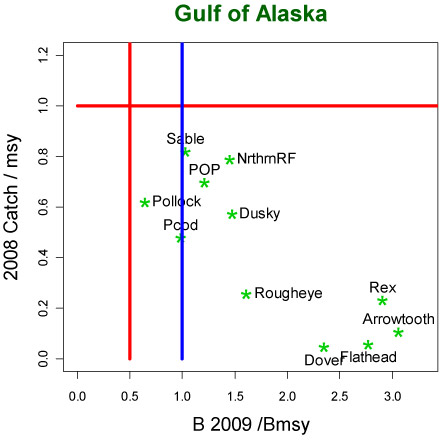
Figure 2. Relative 2009 spawning stock size compared to Bmsy (taken to be B35% for GOA stocks) versus relative 2008 catch levels compared to 2008 Fmsy levels for GOA stocks. Note that Pacific cod stock status is based on previous assessment results.