In the GOA, the sum of the recommended ABCs for 2008 is 536,200 t, which represents a 9% increase from the 2007 total. The largest contributor to this increase was due to the arrowtooth flounder assessment. Brief summaries of each GOA species or species group follows. Units are in metric tons.
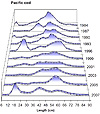
GOA Pollock: The 2007 winter Shelikof Strait EIT survey biomass estimate was 38% less than the 2006 estimate and is the lowest biomass estimate observed from this region. The Alaska Department of Fish & Game (ADF&G) crab/groundfish survey biomass estimate increased 11% from 2006, whereas the NMFS summer bottom trawl estimate was 20% lower than the most recent 2005 estimate. Combining these in the assessment resulted in estimates of spawning biomass for 2008 at around 145,000 t, which is 26% of unfished spawning biomass and below B40% (221,000 t). GOA Pacific Cod: The 2007 survey estimate of Pacific cod was 233,000 t compared to the 2005 estimate of 308,000 t. The assessment analysis presented this year is under review, hence the Council was unable to agree that estimates of 2008 spawning biomass relative to reference points were available. The ABC dropped from previous years by 3% but the catch levels have been a little more than half of the TAC. The survey data suggests that some young fish are moving into the population in this region, as evidenced by a mode of Pacific cod at around 18 cm (Fig. 3).
Table 1. The 2007 catch levels compared to the 2007 and 2008 ABC specifications (and change in ABC) for the groundfish species types for the Gulf of Alaska. In metric tons (t).
Species
2007 Catch
2007 ABC
2008 ABC
Change
Pollock
51,779
68,307
60,180
down 8,127 (12%)
Pacific cod
36,696
68,859
66,493
down 2,366 (3%)
Sablefish
12,539
14,310
12,730
down 1,590 (11%)
Flatfish
14,260
108,367
123,759
up 15,392 14%
Arrowtooth flounder
25,073
184,008
226,470
up 42,462 23%
Rockfish
22,816
33,720
33,548
down 172 (1%)
Atka mackerel
1,441
4,700
4,700
same (0%)
Skates
3,498
8,056
8,321
up 265 3%
Total
168,102
490,327
536,201
up 45,864 9%
Table 2. The 2007 catch levels compared to the 2007 and 2008 ABC specifications (and change in ABC) for the rockfish stock components for the Gulf of Alaska. In metric tons (t).
Species
2007 ABC
2008 ABC
Change
Other slope rockfish
4,154
4,297
3%
Northern rockfish
4,938
4,549
-8%
Pacific ocean perch
14,636
14,999
2%
Shortraker rockfish
843
898
7%
Rougheye rockfish
988
1,286
30%
Pelagic shelf rockfish
5,542
5,227
-6%
Demersal shelf rockfish
410
382
-7%
Thornyhead rockfish
2,209
1,910
-14%
Total
33,720
33,548
1%
GOA/BSAI Sablefish: This year's assessment adopted revised growth estimates within a split-sex model so that differences in growth and maturity between males and females can better be accommodated. The survey abundance index decreased 14% between 2006 and 2007, a change which follows the 13% increase between 2005 and 2006. The fishery abundance index was down 8% from 2005 to 2006. The projected 2008 female spawning biomass is 37% of unfished biomass compared with about 29% of unfished biomass estimated during the 1998 to 2001 period. The 2000 year class now appears to be larger than the 1997 year class and is expected to comprise 18% of the spawning biomass in 2008. The Alaska-wide recommended 2008 ABC is 18,030 t, approximately 10% lower than the 2007 level. GOA Flatfish: Arrowtooth flounder continues to dominate this group (and leads all groundfish based on the 2007 survey biomass estimates (for the western and central GOA). The 2007 survey estimate indicated an arrowtooth flounder biomass of 1.94 million t compared to 470,400 t for Pacific halibut and 894,200 t for all other flatfish species in this region combined. The 2008 ABC recommendation for arrowtooth flounder increased 23% from the 2007 value to 226,500 t (compared to the 2007 catch of 25,000 t). The other flatfish management groups and 2008 ABCs were: deepwater flatfish-8,903 t (compared to 2007 catch of 267 t); shallow-
water flatfish-60,989 t (compared to 2007 catch of 8,042 t); flathead sole-44,735 t (compared to 2007 catch level of 3,105 t); and rex sole-9,132 t (compared to 2007 catch level of 2,846 t). GOA Rockfish: For Pacific ocean perch, the 2008 ABC increased by 2% to 15,000 t based on new survey data and an updated assessment model. For northern rockfish, an updated assessment resulted in a drop in the ABC for 2008 by 8%. Substantial developments in the rougheye rockfish assessment included adding 2002 and 2006 fishery length compositions, four additional years of historic trawl survey age compositions to supplement the regular updates including the 2007 trawl survey biomass estimate, and longline survey estimates. Dusky rockfish comprise the bulk of the "pelagic shelf rockfish" management group and assessment results for this species indicate a stable to increasing trend. However, the ABC for this group has dropped by 6% due to the fact that the 2007 survey estimate was about 2.5 times lower than the 2005 estimate (but in-line with estimates from earlier years). A summary of GOA rockfish ABCs relative to the 2007 levels are given in Table 2.