During fall 2007 a retrospective analysis of trawl survey data was completed to identify assemblages of rockfish in the Gulf of Alaska and Aleutian Islands. The analysis used nontraditional method for identifying assemblages by first calculating catch-weighted mean depth, temperature and position (and associated variance) for each rockfish species commonly captured in the trawl survey. These distributions across environmental variables were then used to calculate an overlap index between species pairs based on niche theory. Clustering of the overlap index between species pairs resulted in four distinct assemblages of rockfish species found on the continental shelf and slope of Alaska (Fig. 1).
The assemblages were sharply divided along gradients of depth and position and, to a lesser extent, along temperature gradients (Fig. 2). The major divisions indicate an assemblage inhabiting mid-depths on the upper slope and shelf and a deeper assemblage distributed with a dividing line at approximately 180 m. In addition to the depth division, another noticeable transition was between species centered in southeastern Alaska and those found in the north Gulf of Alaska and the Aleutian Islands. The distribution of species over environmental gradients was correlated to their frequency of co-occurrence in trawl catches, indicating those species with similar environmental preferences were more likely to be captured together.
The method of defining rockfish assemblages by determining the natural distributions of each species group along environmental gradients and examining the potential overlap among species distributions is different than commonly utilized methods that cluster trawl survey catches or stations with similar catch constituents. However, the method used here provided similar results to other studies and, because it is based on an ecological framework, it may be more robust for prediction and management purposes.
By Chris Rooper
Life History Traits of the Rosethorn Rockfish
The rosethorn rockfish, Sebastes helvomaculatus, is a common scorpaenid inhabiting the west coast of North America from near the Coronado Islands, California (32°34N, 117°22W) to Cape Yakataga, Alaska (59°38N, 142°34W) in the north and the Shumagin Islands, Alaska (54°22N, 160°01W) to the west. Adults inhabit depths from 22 to 507 m and are found in transition zones between mud and hard substrate, often resting on mud in areas protected by boulders or cobble.
Life history studies conducted by the RACE Divisions Groundfish Assessment Program record a maximum observed size of 420 mm fork length (FL) and 1,200 g in a female specimen. Age composition and growth were estimated from sectioned sagittal otoliths of 194 fish collected in 1995. Ages ranged from 6 to 64 years (mean = 21.6 years). Growth was slow and was best described by the von Bertalanffy growth model. Growth rates for males and females were similar with females reaching a slightly larger asymptotic size.
Gonads from 82 specimens were collected throughout 1995. The length at 50% maturity was 228 mm FL for males and 208 mm FL for females. The rate of natural mortality (M) was estimated to be 0.04 using the the gonadosomatic index (GSI) method, as compared to a value of 0.07 using the catch curve and maximum age methods.
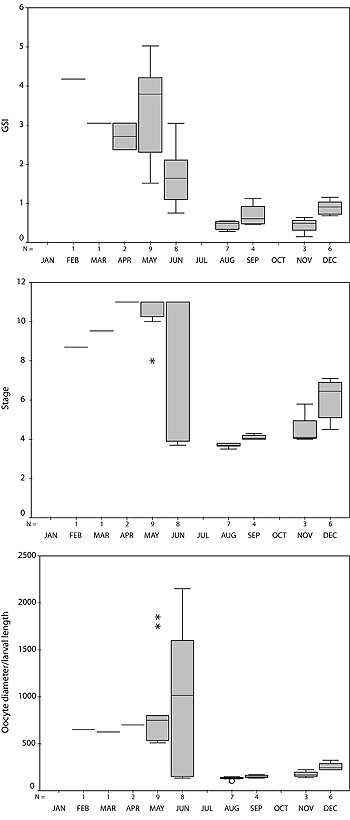
Figure 4. Box plots of the gonadosomatic index (GSI), ovary class, and oocyte/larval size by month for female rosethorn rockfish. The box is the interquartile range. The whiskers are the high and low values excluding outliers (o) and extreme values (*). The line across the box is the median.
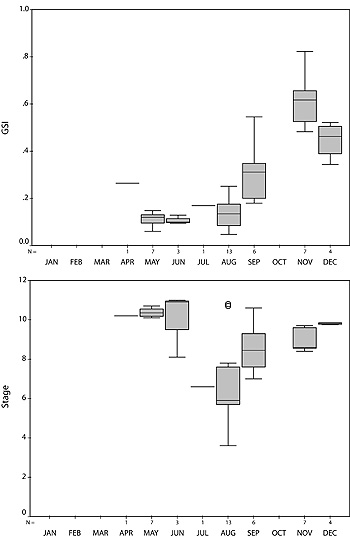
Reproductive observations for rosethorn rockfish showed an annual cycle with group synchronous development producing only one brood per year. Mating probably occurs from December to April off Oregon and Washington, as evidenced by the GSI, which peaked in November for males (Fig. 3 below) and then declined through June during an extended mating season. In females, the GSI peaked in May and declined through August (Fig. 4 right).
Embryos were found in the ovaries 20 April (early embryonic stages), 9 May (mid-to late embryonic stages), and 10 June (late embryonic stages). Parturition occurs in May and June.
By Frank Shaw
Figure 3. Box plots of the gonadosomatic index (GSI) and testis class by month for male rosethorn rockfish. The box is the interquartile range. The whiskers are the high and low values excluding outliers (o). The line across the box is the median.