Resource Ecology & Ecosystem Modeling Program
Ecosystem Modeling
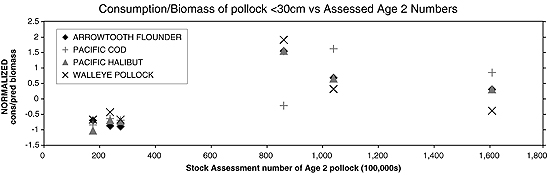
Figure 1. Normalized consumption per unit biomass (g/g wet weight) of pollock <30cm fork length, plotted against
age-2 pollock numbers calculated from the 2005 pollock stock assessment.
Ecosystem modeling and food habits analyses were used extensively in the 2005 North Pacific Fishery Management
Council’s (NPFMC) Gulf of Alaska pollock stock assessment. In particular, trends in predator consumption of pollock
(based on stomach sampling and survey estimates of predator bioamass) were examined in light of concerns of decreasing
pollock biomass coupled with rising populations of arrowtooth flounder, a major predator of pollock. Consumption rates
of four groundfish predators: arrowtooth flounder, Pacific cod, Pacific halibut, and walleye pollock were compared to
numbers-at-age of juvenile pollock estimated by the stock assessment. During years of low age-2 recruitment, consumption
of juvenile pollock by predators was uniformly low (Fig. 1 above).
With increasing pollock abundance, consumption of pollock increased, but seemed to level off or even decline in high
recruitment years, perhaps indicating predator satiation or a separation of pollock from predators in high recruitment
years. In order to include changing natural mortality rates directly in stock assessments, more consideration of the
bioenergetics of predators, particularly arrowtooth flounder, will be required.
By Kerim Aydin
Stable Isotope Analysis of Albatross Diets
| |
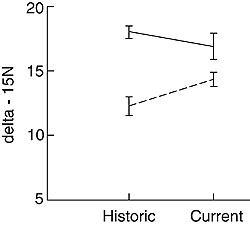
Figure 2. Delta-15N values (mean ± standard error) of Laysan albatross (dotted line) and black-footed albatross
(solid line) feathers. Values are indicative of diets in July. Historic birds were collected on the breeding colonies
before 1925. Current birds were collected predominantly behind fishing vessels since 1995. n = 15 for each category. |
The impact on North Pacific seabirds of provisioning (i.e., food availability through discards and offal) by the
Alaskan groundfish fishery continues on two fronts: a quantitative analysis of fish and fish parts returned to the sea
and a stable isotope (delta-15N) study investigating the use of fisheries discards and offal by Laysan and black-footed
albatrosses (Fig. 2).
In consultation with fishing industry representatives, we are estimating at-sea offal discharge rates based on product
recovery rates and total retained catch estimates. An important component of this investigation is a comparison of
discharge rates between at-sea and shore-based processors, with particular emphasis on the presence or absence of fish
meal plants at the processing facilities.
The delta-15N value of an animal’s tissue is indicative of the level at which that animal feeds in the food chain. Higher
values correspond to higher trophic levels. Preliminary data from the delta-15N values of feathers clearly show that the
diets of Laysan and black-footed albatrosses have shifted over the last 80 years, a period corresponding to the rise of
large-scale commercial fisheries in the North Pacific. Historically (before 1925), the diets of Laysan and black-footed
albatrosses during the nonbreeding season differed by an average of almost two trophic levels.
Currently (after 1995), the diets of Laysan and black-footed albatrosses collected mostly behind fishing vessels differed
on average by less than one trophic level. Thus, the dietary overlap of these two closely related but distinct species
has increased with the advent of commercial fishing. The shift in delta-15N values from a “natural” diet before 1925 to
a fisheries-enhanced diet today produces a quantifiable, stable isotope “fisheries signal” (most notable in Laysan
albatrosses). This signal provides a tool for investigating the population-level effects of fisheries on albatrosses.
By Ann Edwards
>>>continued
 |

|
OND2005 quarterly sidebar
AFSC Quarterly
Research Reports Oct-Dec 2005
Contents
Feature
ABL Reports
FMA Reports
NMML Reports
RACE Reports
REFM Reports
Milestones
Quarterly Index
Quarterly Home
|
