Groundfish Assessment Program
Effect of Unequal Trawl Warps on Trawl Geometry
| |
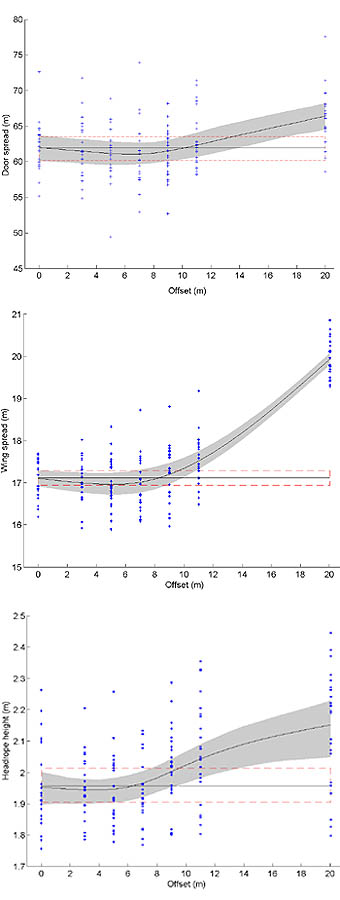
Figure 6. Mean door spread, wing spread, and headrope height is shown (+) plotted against offset
increment. The means for all values of offset increment were fit with a cubic spline function (solid
curve). Bootstrapped 95% confidence bounds are shown with shading. Also shown are the mean door spread,
wing spread, and headrope height considering only treatments with zero offset (solid horizontal line)
and the bootstrapped 95% confidence bounds (dashed horizontal lines).
|
Survey standardization procedures can reduce the variability in trawl catch efficiency, thus producing
more precise estimates of biomass. One such procedure, towing with equal amounts of trawl warp when using
locked winches was experimentally investigated for its importance in determining optimal trawl geometry and
for evaluating the effectiveness of the recent NMFS national protocol on accurate measurement of trawl warps,
which states that warp length differences between the port and starboard sides cannot exceed 4% of the distance
between otter doors measured along the bridles and footrope.
Trawl performance data from repetitive towing
with warp differentials of 0, 3, 5, 7, 9, 11, and 20 m were analyzed for their effect on three determinants
of flatfish catch efficiency: footrope distance off bottom, bridle length in contact with the bottom, and
area swept by the net.
Results indicated that the distortion of the trawl caused by asymmetry in trawl warp
length could have a negative influence on flatfish catch efficiency, although determining the degree of impact
would require further experimentation utilizing catch data.
At a 7-m difference in warp length, the NMFS 4%
threshold value for the 83-112 Eastern survey trawl used in this study, no effect was found on the
acoustic-based measures of door spread, wing spread, and headrope height off bottom (Fig. 6). However, the
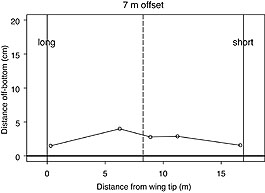
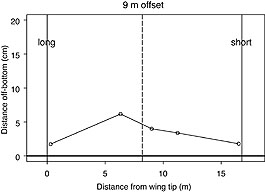
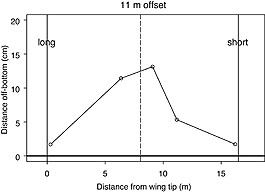
sensitivity of the trawl to 7 m of warp offset could be seen as footrope distances off bottom increased
slightly, particularly in the center region of the net where flatfish escapement is highest (Fig. 7 below)
and the width of the bridle path responsible for flatfish herding was reduced (Fig. 8 below), as was the
effective net width (Fig. 9 below).
For this survey trawl, a NMFS threshold value of 4% should be considered
a maximum. A more conservative value (< 4%) would likely reduce potential bias in estimates of relative
abundance caused by large differences in warp length approaching 7 m.
By Ken Weinberg
 |
 |
|
 |
 |
|
 |
 |
|
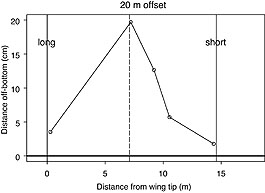 |
Figure 7 (above). Mean off-bottom distances in cm at the five bottom contact sensor positions
along the footrope (circles) are shown for each warp offset. The positions are projected onto the
wing tip to wing tip plane to depict the footrope as it would appear looking into the net from the
direction of travel. The vertical solid lines indicate the positions of the wing tips on the long
warp and short warp sides of the trawl. The dashed line indicates the midpoint between wing tips.
Note that the projection considers the reduction in effective net width with increasing offset.
|
 |
|
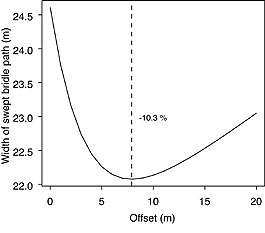 |
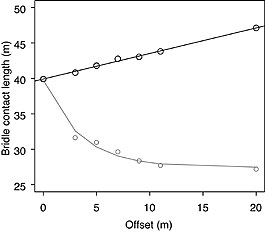
Figure 8 (above). The length of the bridle <1 cm from the bottom is shown plotted against the offset
increment in meters for both the short warp (grayline) and long warp (blackline) sides of the trawl (top).
Assuming that the angle of attack is the same for the long and short sides of the trawl, the width of the
swept bridle path as a function of warp offset is represented in the lower panel.
|
 |
|
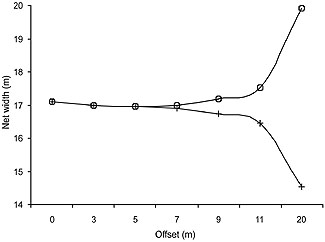
Figure 9. (above) The mean distance between wing tips measured acoustically (O) during the experimental
tows (net width) and the calculated effective net width (+) are shown plotted against the offset
increment in meters. Note that there is little difference between the two measures of net width until
the offset increment is increased to 9 m. |
>>>continued

|

|
Quarterly sidebar
AFSC Quarterly Research Reports Oct-Dec 2004
Contents
Feature
Items
ABL Reports
NMML Reports
RACE Reports
REFM Reports
Quarterly Index
Quarterly Home
|
