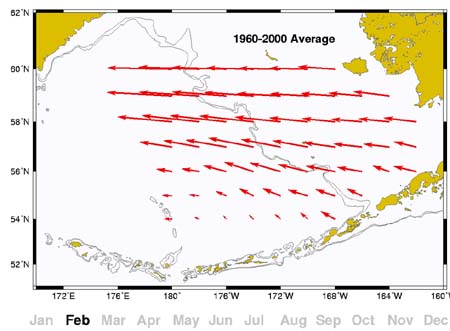
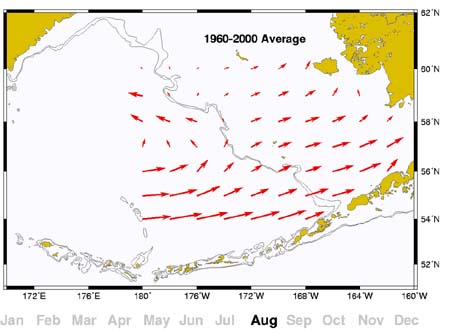
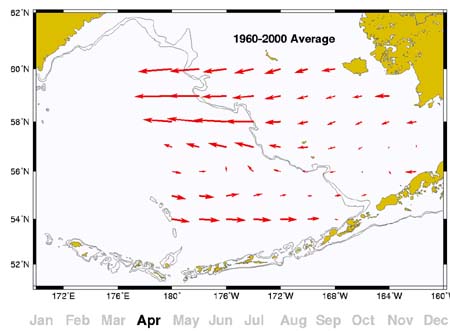
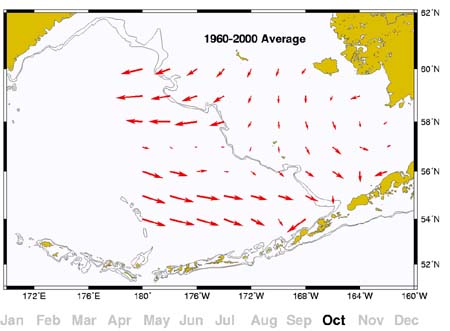
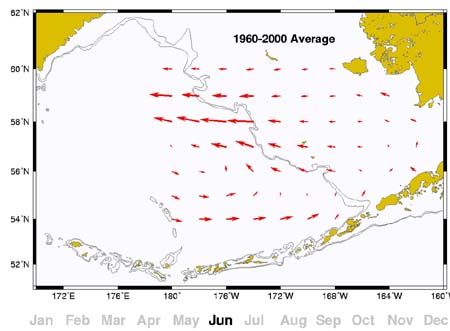
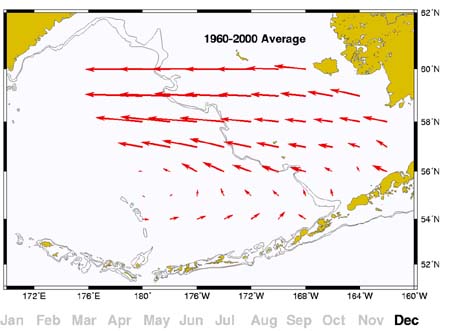
Figure 1. Average surface currents based on OSCURS model,
1960-2000 for February, April, June, August, October, and December.

map of surface currents for February 1960-2000


map of surface currents for April 1960-2000


map of surface currents for June 1960-2000


map of surface currents for August 1960-2000


map of surface currents for October 1960-2000


map of surface currents for December 1960-2000