Genetic Evidence for Population Structure in Northern North Pacific Killer Whales (cont.)
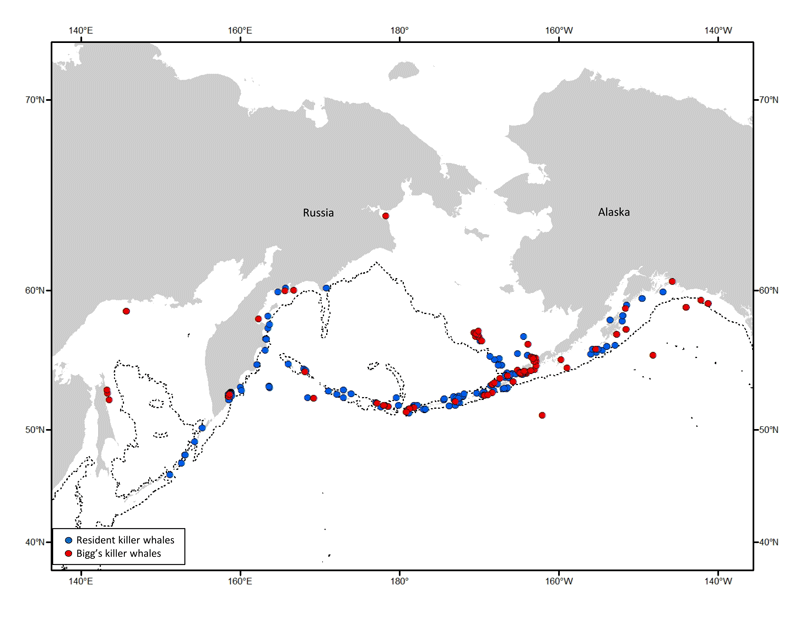
Figure 2. Map of killer whale biopsy sample locations included in the current study. Symbols indicate ≥1 individual sample.
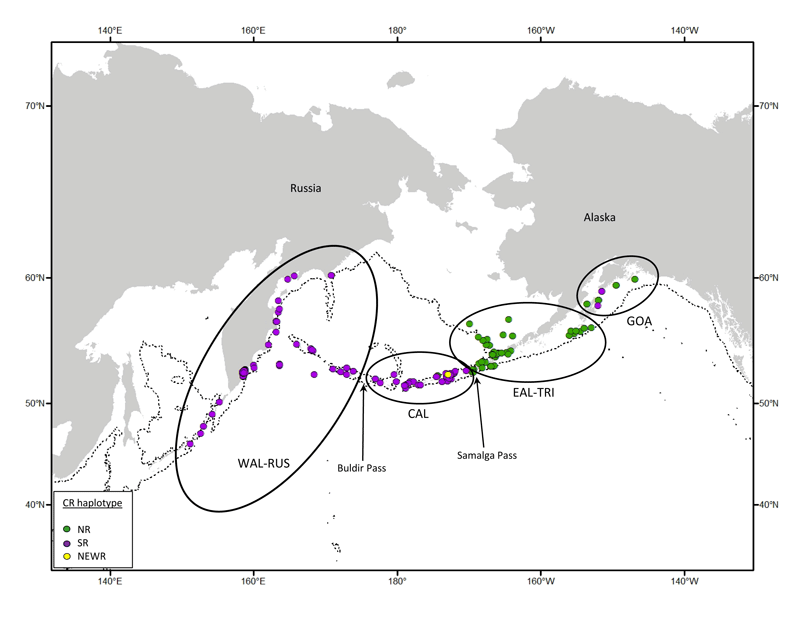
Figure 3. Resident killer whale biopsy samples included in the current study, plotted according to sample locations. Solid-line ellipses indicate the geographic extent of genetic subpopulations based on analysis of nDNA and mtDNA data. Individual samples are color coded according to mtDNA control region (CR) haplotype. The 1,000-m bathymetric depth contour is indicated by a thin broken line.
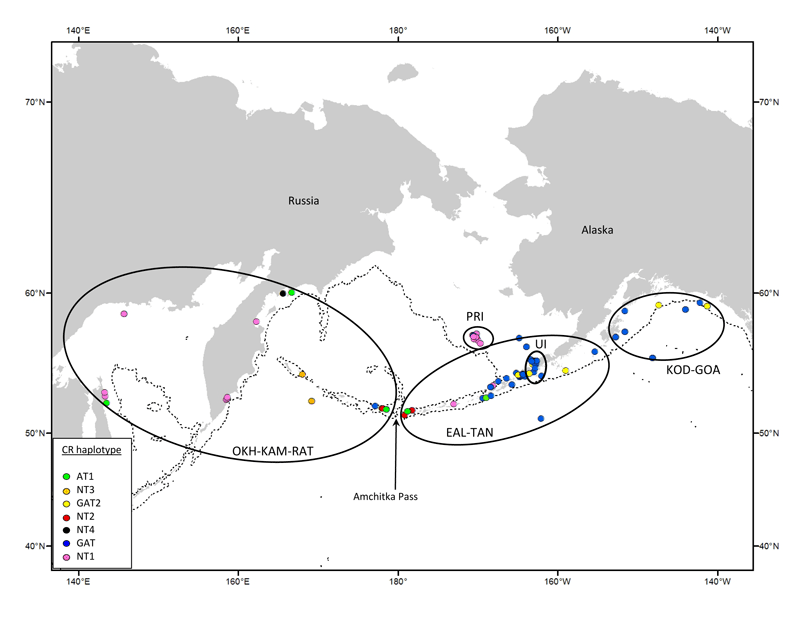
Figure 4. Bigg’s killer whale biopsy samples included in the current study, plotted according to sample locations. Solid-line ellipses indicate the geographic extent of genetic subpopulations based on analysis of nDNA and mtDNA data. Individual samples are color coded according to mtDNA control region (CR) haplotype. The 1,000-m bathymetric depth contour is indicated by a thin broken line.