|
|
| Error processing SSI file |
|
||
|
Feature: Part 5
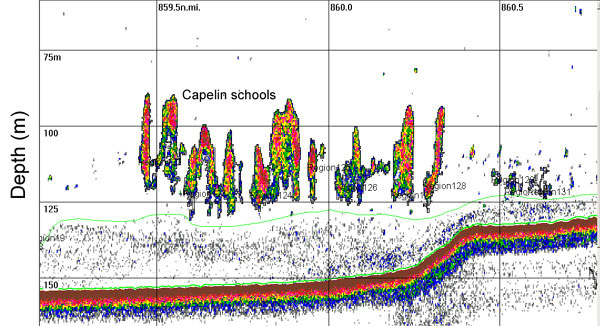
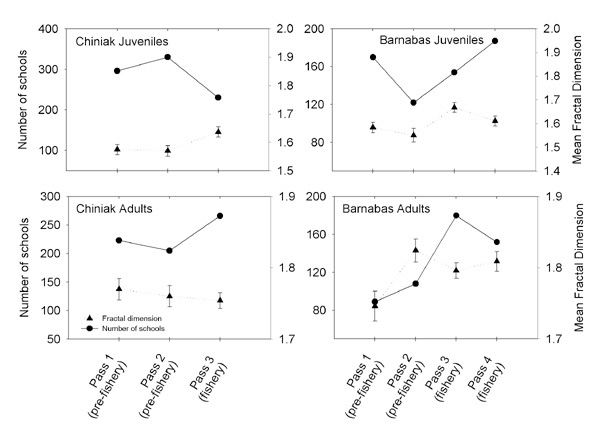
The analysis of adult and juvenile pollock and capelin patch (or aggregation) dynamics may help in determining the impact of commercial fishing activities at these spatial scales (Fig. 8 above). The following results suggest several interesting patterns (Fig. 9). Greater numbers of both adult and age-1 pollock schools were identified in Chiniak compared to Barnabas on all passes. This was intriguing with regard to the adults, given that the adult biomass was generally less in Chiniak than Barnabas yet the fish were distributed over a greater portion of the trough in Chiniak. Estimates of pollock patch fractal dimensions were generally less for juveniles than for adults, suggesting a greater shape complexity for the adult aggregations. No significant differences were detected in either trough for adult estimates from prefishery passes compared to those during the fishery. However, the adult fractal estimate in Barnabas during pass 1 (prefishery period) differed significantly from subsequent passes during prefishery and fishery periods. Whether this trend is associated with the large estimated biomass that occurred for pass 1 is uncertain at this time, and verification of these initial patch analyses must still be completed.
Figure 9. Estimated pollock school fractal dimensions for adult age-1 pollock in Chiniak and Barnabas Troughs in August 2001. Juvenile pollock fractal estimates from the prefishery survey passes were significantly less than those during the fishery. It is important to bear in mind that the juvenile estimates in Chiniak, which served as the control site where commercial fishing was prohibited, exhibited the same significant trend during this time period. Thus the increase in fractal values that occurred during the fishery period was caused by factors unrelated to the fishery itself; possibly the presence of an intense storm that followed completion of the final prefishery pass (pass 2) and prior to the start of the fishery survey passes (passes 3-4). These results illustrate the value of a control site in this type of study. Two years (August 2000 and 2001) of a multiyear fishery interaction study off the east side of Kodiak Island have now been completed. The initial results of these surveys provide important information that begins to address the question of whether the abundance and spatial patterns of various species, including walleye pollock and capelin, are impacted by commercial fishing activities over short spatiotemporal scales. These preliminary results highlight potentially important findings. The successful application of EIT survey methods demonstrated that these methods could be used in this time of year in this region of the GOA to assess pollock and capelin. The biomass and distribution of pollock were reasonably stable over periods of days to weeks, although during the second year an unusual, extremely dense, small-scale pollock aggregation was detected (Barnabas pass 1). It may be necessary to adjust survey methods to account for this high level of patchiness if this is common for adult pollock during August. Preliminary results from the second year, when the commercial fishery took place within the study area, have yet to suggest a significant link between fishing activities and changes in adult and age-1 pollock geographical distribution, biomass, vertical distribution, or school fractal dimensions. It will be important, however, to evaluate whether these trends persist during subsequent years. Other descriptors of school size and shape will be evaluated to better understand whether differences at the scale of the school level occurred in response to fishing. The stability of spatial patterns for other potential sea lion forage species such as capelin, which generally occurred higher in the water column, were greater than for pollock. Subsequent analyses may find this increased variability particularly challenging in efforts to understand whether fishing effects impact this species. The work to characterize the interactions between commercial fishing activities and potential sea lion prey has just begun. It is clear from the preliminary results of the east Kodiak study that more years of fieldwork are needed to define the limits in any potential interactions that may exist between the fishery and potential sea lion prey species. The incoming strong year class of pollock observed in 2001 (Fig. 3) will provide an important opportunity during the next 2 years of the study to investigate whether variations in the pollock age composition influence responses to fishing activities. If significant responses by pollock or other species are detected, additional survey passes will be conducted following completion of the fishery to document the duration of the perturbation. Other developing technologies will be used in future field efforts to improve the species identification of scattering layers; they include the addition of an open/closing codend for the research trawls and the use of multiple acoustic frequencies. Additional bottom trawling efforts may be included to provide abundance estimates for demersal (i.e., within 0.5 m of bottom) pollock, which are unavailable to the acoustic survey method. In situ target strength measurements will be collected on forage species so that estimates of absolute abundance can be made. Finally, as resources become available, efforts will be made to expand the east Kodiak fieldwork to other seasons and then to design similar experiments in other areas and seasons to evaluate whether regional differences exist.
|
|
AFSC Quarterly Feature Auke Bay Lab National Marine Mammal Lab RACE Division REFM Division Quarterly Index Quarterly Home |
|
|
||
|
|
||