Resource Ecology & Ecosystem Modeling (REEM) Program
Fish Stomach Collection and Lab Analysis
Laboratory analysis was performed on 1,475 groundfish stomachs from the eastern Bering Sea (EBS), and 837 groundfish stomachs from the Gulf of Alaska. During this quarter, 780 stomachs were analyzed during research surveys in the Bering Sea, and 1,402 stomachs were analyzed during surveys in the Aleutian Islands region. Also during this quarter, 2,688 stomachs were collected during the Bering Sea survey, and 1,000 stomachs were collected during the Aleutian Islands survey. In addition, fisheries observers collected 708 stomach samples from the Bering Sea and 302 stomachs from the Gulf of Alaska. A total of 13,797 records were added to the groundfish food habits database.
By Troy Buckley, Geoff Lang, Mei-Sun Yang, and Kerim Aydin
Ecosystem Modeling
Modelers from the Resource Ecology & Ecosystem Modeling (REEM) Program recently collaborated with researchers from REFM’s Stock Assessment & Multispecies Assessment (SSMA) program and the University of Washington (UW) to incorporate trophic interactions within a Management Strategy Evaluation (MSE) for Gulf of Alaska pollock. REEM is providing information on potential changes in pollock mortality under different ecosystem conditions in a streamlined format that allows SSMA and UW scientists to minimize computational complexity within the MSE.
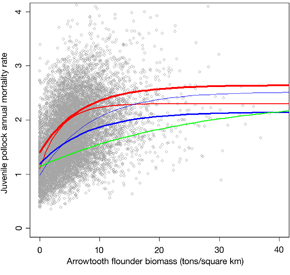
This summer, we distilled results from thousands of Gulf of Alaska ecosystem model runs into functional relationships between pollock mortality and predator biomass, which considered different levels of pollock biomass and ecosystem-wide primary productivity. Preliminary results show fairly strong relationships between the biomass of a handful of key predators and total pollock mortality. The relationship is especially strong between juvenile pollock mortality and arrowtooth flounder biomass (Fig. 1).
In general, these results suggest that pollock mortality increases with predator biomass more quickly and to a higher level when pollock biomass is relatively low (red lines), and that individual predators affect pollock mortality to a lesser extent when pollock biomass is high (green line). However, at low and intermediate pollock biomass (red and blue lines ), ecosystem productivity can influence the relationship as well. For example, the thin blue line demonstrates that under conditions of low primary productivity, pollock mortality may increase quickly with predator biomass even though pollock biomass is at an intermediate level. Under conditions of higher ecosystem primary productivity, these results suggest that pollock mortality increases less quickly with increasing predator biomass (thick blue line). REEM modelers will continue to refine this work in collaboration with SSMA and UW to provide a full range of ecosystem interactions for analysis within the Gulf of Alaska pollock MSE.
Figure 1. Relationship between Arrowtooth flounder biomass and juvenile pollock mortality from 9,845 simulations with the Gulf of Alaska ecosystem model. Each point is the output of an individual model run. Each line represents the best fit relationship between flounder biomass and pollock mortality under different levels of pollock biomass and overall ecosystem production. Red lines indicate low pollock biomass (below the stock assessment reference point indicating 25% of unfished biomass), blue lines indicate intermediate pollock biomass, and the green line indicates high pollock biomass (above the stock assessment reference point indicating unfished biomass). Thickness of lines represents overall ecosystem production. Thinner red and blue lines indicate primary productivity at or lower than estimated current levels, and thicker lines indicate higher primary productivity than estimated current levels. Primary productivity had no impact on the relationship when pollock biomass was high (single green line).