|
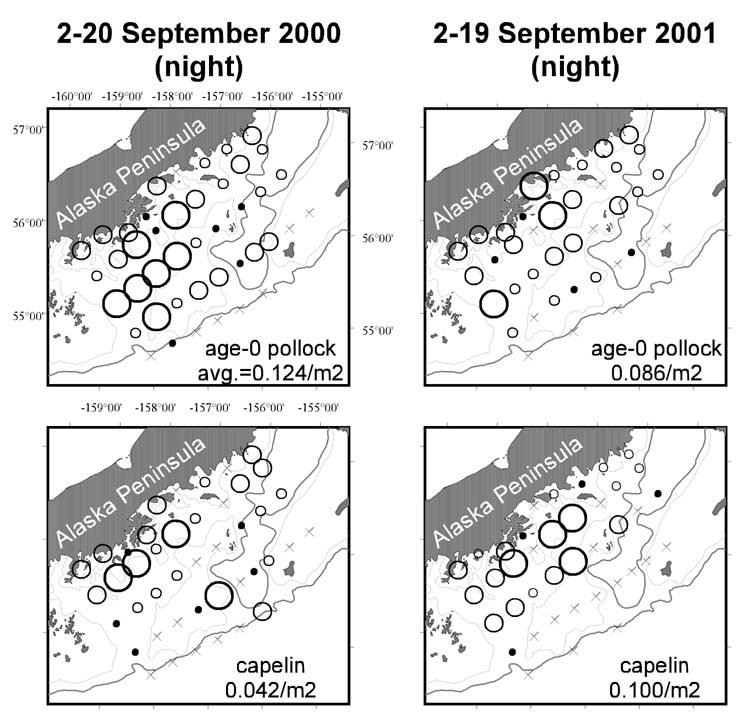
Figure 1. Log10-transformed
abundance (fish/m2) of
age-0 pollock and capelin collected at night in midwater
trawl hauls during September 2000 and 2001.
Non-zero catch bins, and the associated plot symbol
size, were constructed using the mean (x) and standard
deviation (sd) for each species and year. |

|