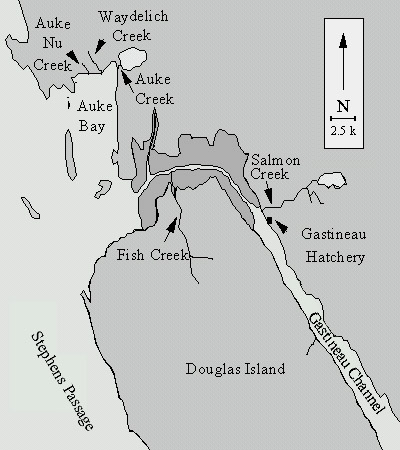
Figure 3. Map showing the location of Auke Creek, Gastineau Hatchery, and other
creeks sampled for stray Auke Creek and Gastineau Hatchery pink salmon.
Figure 3. Map showing the location of Auke
Creek, Gastineau Hatchery, and other
creeks sampled for stray Auke Creek and Gastineau Hatchery pink salmon.
| Table 1. The number of fry released and the survival of coded-wire tagged (CWT) otolith-marked, CWT wild, and otolith-marked Auke Creek pink salmon. The entire return of 4,295 pink salmon was examined for excised adipose fins (indicating a possible CWT). Tag recoveries were expanded for the proportions of adipose-clipped pink salmon where no CWT was recovered or the CWT was lost during removal. The otolith-marked fish exclude CWT fish with otolith-marks. Observed numbers (in parenthesis) of otolith marks from a sample of 1,196 carcasses were expanded to represent the total return of pink salmon to Auke Creek. Survival (%) of each run component and the associated standard deviation (SD) is also presented. | ||||||
Mark Group |
Fry Released |
SD (Fry) |
Adults |
SD |
Survival (%) |
SD (Survival) |
CWT/ |
|
|
|
|
|
|
CWT/ |
|
|
|
|
|
|
CWT/Wild |
44,270 |
0 |
73 (61) |
9.3 |
0.16 |
0.021 |
Otolith-mark |
|
|
|
|
|
|
Otolith-mark |
|
|
|
|
|
|
| Table 2. Number sampled, population estimates and associated 95% confidence intervals (CI), and estimated proportion of run for five creeks within 14 km of Auke Creek that were sampled for coded-wire tags and otolith thermal marks. All pink salmon returning to Gastineau Hatchery were examined for coded-wire tags; a sample of the total return was examined for otolith-marks. No population estimate was made for Salmon Creek. | ||||
Sample Site |
Number of Carcasses Sampled |
Population Estimate |
95% CI Population Estimate |
Estimated Proportion of Population Sampled |
Fish Creek |
546 |
2,492 |
1,425-2,688 |
0.219 |
Waydelich Creek |
164 |
304 |
131-328 |
0.539 |
Auke Nu Creek |
47 |
136 |
17-513 |
0.346 |
Salmon Creek |
225 |
NA |
NA |
NA |
Gastineau
|
|
|
|
|
Gastineau Hatchery (Otolith-marked) |
|
|
|
|
| Table 3.
Recoveries and estimated numbers of otolith-marked and coded-wire tagged (CWT) pink
salmon from carcasses at Auke Creek and five sample sites within 14 km of Auke Creek.
Estimated numbers of marks at the site expanded for sampling rate are shown in
parentheses. Total strays are the number of marked fish which did not home to their stream
of origin. For marked groups, AC = Auke Creek, GH = Gastineau Hatchery. |
||||||
| Sample Site | MARK GROUPS | |||||
| AC Wild CWT | AC Early CWT | AC Late CWT | AC Early otolith-mark | AC Late otolith-mark | GH otolith-mark | |
Fish Creek |
0 |
0 |
1 (5) |
5 (23) |
8 (36) |
28 (128) |
Waydelich Creek |
|
|
|
|
|
|
Auke Nu Creek |
0 |
0 |
0 |
1 (3) |
0 |
2 (6) |
Salmon Creek |
0 |
0 |
0 |
4 |
13 |
33 |
Gastineau Hatchery |
|
|
|
|
|
|
Auke Creek |
61 (73) |
111 (133) |
71 (85) |
412 (1,380) |
413 (1,383) |
46 (154) |
Total Returns |
62 (74) |
111 (133) |
73 (91) |
430 (1,443) |
444 (1,482) |
638 (4,527) |
Total Strays |
1 (1) |
0 |
2 (6) |
18 (66) |
31 (103) |
89 (312)1 |
| 1Assumes homing of Gastineau Hatchery pink salmon returning to the Salmon Creek watershed, which includes both Gastineau Hatchery and Salmon Creek. | ||||||
| Table 4. Number of strays and straying rates of Auke Creek coded-wire tagged (CWT) and Auke Creek and Gastineau Hatchery otolith-marked pink salmon based on recoveries of marked fish expanded for sampling where appropriate estimates expanded for sampling are in parentheses. Confidence intervals (CI) were obtained by taking percentiles of 1000 iterations of a parametric bootstrap model incorporating variances of population estimates and of mark sampling. | ||||||
Mark Group |
Within 10 km of Auke Creek |
Within 14 km of Auke Creek |
||||
Number Strays |
Straying Rate |
Number Strays |
Straying Rate |
|||
% |
CI |
% |
CI |
|||
CWT |
|
|
|
|
|
|
Otolith-marks |
|
|
|
|
|
|
Gastineau Hatchery |
|
|
|
|||