Quantifying Area Disturbed by Trawl Fishing Gear in the Eastern Bering Sea, 1990-2009
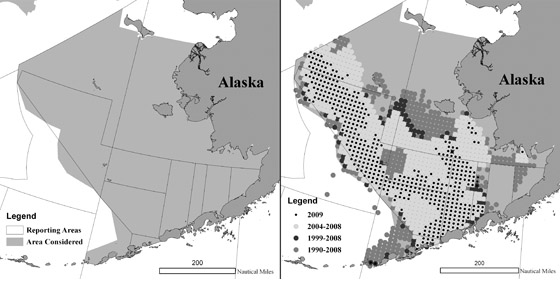
Figure 3 (left). Map of eastern Bering Sea area considered when estimating percent of area potentially disturbed by trawl fishing gear. Figure 4 (right). Map of 400 square kilometer cells with some trawling in cumulative time periods. Cells with fewer than three vessels are not shown.
Fishing gear can affect habitat used by a fish species for the processes of spawning, breeding, feeding, or growth to maturity. An estimate of the area of seafloor disturbed by trawl gear may provide an index of habitat disturbance. The area disturbed in the eastern Bering Sea was calculated from observer trawl data each year from 1990 to 2009. The duration of each trawl haul was multiplied by a fishing effort adjustment as outlined in Appendix B of the January 2005 EFH EIS (www.fakr.noaa.gov/habitat/seis/efheis.htm).
The adjustment converted trawl haul duration to area disturbed based on the type of trawl gear used (pelagic or bottom) and the vessel length. The adjustment also expanded smaller vessel fishing effort, which has 30% observer coverage, to simulate 100% coverage. Records of missing trawl haul duration data and short wire hauls (hauls pulled in but not immediately brought on board) were assigned the average trawl haul duration over all years of 228 minutes (no more than 5% of hauls in any given year needed this adjustment).
An upper limit of the total area potentially disturbed by trawl hauls was estimated by assuming that no trawl hauls overlapped spatially. To estimate the percent disturbed, it was necessary to determine the total area of the eastern Bering Sea being considered. The NMFS reporting areas for the Bering Sea were used as a baseline; however, Norton Sound was excluded because it is beyond the range of many commercially fished groundfish species. The Bering Sea Habitat Conservation boundary was used to exclude areas beyond the shelf break. The resulting total area considered was 742,647 km2 (Fig. 3).
The percentage of area disturbed was estimated in two ways: 1) with no spatial overlap of trawl hauls in a given year, providing an estimate of the maximum potential percent of area disturbed and 2) with spatial overlap of trawl hauls within 400 km2 cells to limit the disturbance of trawls recorded in a cell to 400 km2, providing an estimate of the potential percentage of area disturbed. The average distance of a haul based on recorded start and end locations is 14 km with a standard deviation of 10 km. The cell size was chosen to reflect this spatial resolution of the hauls. Though this cell size allows some overlap of hauls, it still may overestimate the percent area disturbed in a year. Figure 4 shows the locations of the 400 km2 cells where trawling disturbances accumulated over various time intervals.
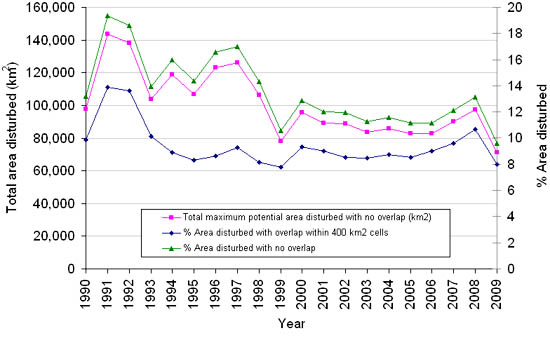
Status and Trends: The maximum total area of seafloor in the eastern Bering Sea potentially disturbed by trawl gear varied around 120,000 km2 in the 1990s and decreased in the late 1990s to approximately 90,000 km2. The area disturbed remained relatively stable in the 2000s with a slight increase during 2007-08. The percentage of total area disturbed varied between 10% and 15% in the 1990s and between 9% and 11% in the 2000s. However, due to trawls overlapping the same area, a more realistic estimate of area disturbed was likely less than 10% from the mid-1990s on. Reduction in hours fished in the 2000s indicates greater fishing efficiency.
Figure 5. Total maximum potential area disturbed (assuming no spatial overlap of trawls), and the percent area disturbed. The black line, representing percent area disturbed, sums the area disturbed assuming no spatial overlap of trawl hauls in a year, thus providing an upper limit to the estimate of area disturbed. The dark gray line represents the percent area disturbed with spatial overlap of trawl hauls within 400 km2 cells, thereby, limiting the disturbance of trawls recorded in a cell to 400 km2.
Factors Causing Trends: Trends in the extent of seafloor area disturbed can be affected by numerous variables such as individual fishery movements, fish abundance and distribution, management actions (e.g., closed areas), changes in the structure of the fisheries due to rationalization, increased fishing skills (e.g., increased ability to find fish), and changes in vessel horsepower and fishing gear.
During 1993-99, fishing effort was more concentrated in the southern area compared to 1990-92 and 2000-08, where effort was spread out spatially, particularly towards the northwest. This may, in part, explain the larger difference between the upper and lower estimates of percent area disturbed (with no overlap and with overlap within 400 km2 cells, respectively) during 1993-98 relative to other years (Fig. 5).
As of 1999 only pelagic trawls can be used in the Bering Sea pollock fisheries. To check to see if this affected the trends, the graph was recalculated making no distinction between gears. The result showed no change in the trend. Short hauling which are hauls which a net is pulled in but not immediately brought on board was only identified in the database from 1995 onward, however short hauling accounts for only 2% of the total hauls and does not explain the early 1990 trends.
Implications: Habitat damage varies with the physical and biological characteristics of the areas fished, recovery rates of HAPC biota in the areas fished, and management changes that result in spatial changes in fishing effort.