Key Results of 2014 Observer Program Deployment
The following is a summary of some of the accomplishments of the Observer Program in 2014. Note that some of these accomplishments combine statistics from both full and partial coverage categories.
A total of 436 individual observers were trained, briefed, and equipped for deployment to vessels and processing facilities operating in the Bering Sea and Gulf of Alaska groundfish fisheries.
Rates of observer deployment at-sea were within expected ranges.
Observers collected data onboard 417 fixed-gear and trawl vessels and at 14 processing facilities for a total of 44,178 observer days.
With few exceptions, the observer provider company AIS Inc. successfully deployed observers from 30 ports for 4,368 days at sea with a minimal number of trips released from coverage.
There were 97 debriefings completed in Anchorage by 3 FMA staff and 572 debriefings in Seattle completed by 21 FMA staff.
NMFS held outreach events in Seattle, Petersburg, Sitka, Juneau, Kodiak, and Homer to maintain a dialogue with industry members and inform them about changes to the program, vessel responsibilities, and the objectives of quality collection of data and management.
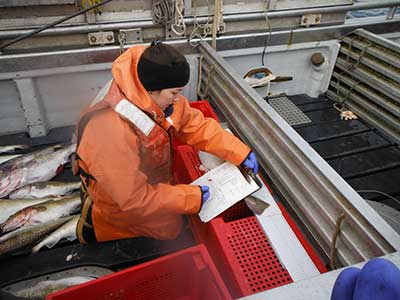
An observer sampling on a trawl-catcher vessel. Photo by Danielle Watson.
Did We Meet Anticipated Deployment Goals?
The Observer Program met expected rates of coverage for the full-coverage regulatory and full-coverage voluntary strata, the trip selection stratum, four of six time-periods within vessel selection, and the partial coverage no selection (Table 1).
Observer coverage was higher than the expected 12% selection rate in two of the six time periods within vessel selection. Vessels were selected for sampling based on whether they fished in 2013. This resulted in a discrepancy between the sampling list and the list of vessels that actually fished. In addition, the unpredictability in the number of vessels that would be granted conditional releases meant that NMFS “oversampled” in some of the vessel selection time periods. These problems were also highlighted in the 2013 Annual Report and were part of the rationale for moving all vessels to the trip selection method in 2015.
Random selection of trips in the trip selection stratum is facilitated by the ODDS system. Users of the system are given flexibility to accommodate their fishing operations; up to three trips may be logged in advance of fishing, and trips can be cancelled to accommodate changing plans. Once a trip has been completed, logged trips must be closed by a vessel operator.
If a trip is selected for observer coverage and cancelled by the user, then the vessel's next logged trip is automatically selected for coverage. The "inherited" trips preserve the number of selected trips in the year, but cannot prevent the delay of selected trips during the year, which resulted in temporal bias.
In 2014, ODDS users cancelled trips that had been selected for coverage at nearly four times the rate of unselected trips. Since only cancelled trips that had been originally selected are preserved, the final selection rate in ODDS was higher than if selected trips had not been disproportionately cancelled.
Was the Coverage Representative?
NMFS evaluated the possibility for temporal bias in the trip selection stratum. Although coverage rates were lower than expected at the beginning of the year, the final coverage rate was within expected ranges. In 2014, the spatial distribution of observer coverage in trip selection was as would be expected under a random sample of trips. In vessel selection, however, there were more observed vessels in certain NMFS reporting areas than would be expected under random deployment. This result highlights the difficulty in obtaining an adequate sampling frame in vessel selection.
NMFS expanded the comparison of trip metrics between various categories of vessels relative to the analysis conducted in the 2013 Annual Report. In both the 2013 version and the 2014 Annual Report, NMFS compared trip duration (number of days), number of NMFS areas visited during a trip, landed catch weight, species diversity (the number of different species in the landed catch), and the proportion of landed catch that was due to the predominant species in the catch (the “purity” of the catch). For 2014, NMFS added comparisons of vessel length to the trip metrics and performed analyses using permutation tests instead of visual inspection of histograms.
Comparison of tender trips and non-tender trips:
Vessels that delivered to a tender were 11.5% shorter in length, fished 29.1% longer in duration, and had catch that was 1.3% less “pure” than vessels that did not deliver to a tender.
Comparison of observed and unobserved trips delivered to tenders:
The analysis found no differences in NMFS areas visited during a trip, trip duration, the total weight of landed catch, or the number of species in the landed catch. The permutation tests did, however, indicate a difference in vessel length and the proportion of the predominant species in the landed catch for observed and unobserved vessels delivering to tenders. Observed vessels delivering to tenders were 8.8% shorter than unobserved vessels delivering to tenders. The landed catch by observed vessels delivering to tenders was 6% less “purely the predominant species” than landed catch by unobserved vessels delivering to tenders.
Comparison of observed unobserved trips delivered shoreside (i.e., non-tender): Trip selection: Hook-and-line vessels that were observed landed 14.4% less catch and 9.1% more species than unobserved vessels. Trawl vessels that were observed fished in 4.2% fewer areas and were 8.4% shorter in duration than unobserved vessels. There were no differences between observed and unobserved trips for vessels that fished pot gear. Taken together, there is evidence of an observer effect in trip selection hook-and-line and trawl gear. Vessel selection: Six trip metrics were evaluated for each of the 6 time periods (36 comparisons). Of the 36 tests, 18 showed significant differences between observed and unobserved trips providing evidence of an observer effect in vessel selection.
Based on the 2014 Annual Report and recommendations made by NMFS, the Council provided a number of recommendations for consideration in the development of the 2016 Annual Deployment Plan and future annual reports, including:
Provide additional information on observer rates and percent coverage by gear type, in addition to numbers of trips by coverage category (full or partial coverage).
Determine best approaches to a trip identifier tied to landings data to provide a linkage between ODDS and eLandings and improve data analysis, including those trips delivered to a tender.
Evaluate and suggest modifications to ODDS to reduce temporal bias associated with the policy of allowing trip cancelation and logging multiple trips prior to departure.
Develop tools to evaluate both the reliability of the data and deployment performance.
Assess inefficiencies in the program and ways to achieve cost efficiencies in the partial coverage category within the existing 5‐year contract.
Provide information about the availability of fixed-gear lead level 2 observers.
Add quantitative measures in the enforcement section of the report, especially in relation to trends by incident type.
Define strata to deploy observers by gear (longline, pot, and trawl gear) and FMP area and, if necessary, consider operational sector (CV vs CP).
NMFS is in the process of considering these recommendations and, to the extent possible, incorporating them into the Draft 2016 Annual Deployment Plan, which will be presented to the Council at the October 2015 meeting. This iterative process of analyzing the previous year’s deployment performance provides the Agency and the Council with flexibility to amend and improve the Observer Program on an annual basis.