Our primary goal of confirming the accuracy of the growth zone counts was largely achieved, and some guidance in choosing the best interpretation also was provided. The sequential δ18O measurements demonstrated clear seasonal signatures (Fig. 7) which made this validation possible. The percent agreement between the growth zone counts and the number of δ18O maxima was 61.18%, the average coefficient of variation was 8.04%, and the average percent error was 5.69%. Considering specimens individually, specifically the locations of counted translucent growth zones with respect to δ18O maxima, provided results in greater detail. For example, Figure 7 shows four images of thin-sections annotated with the counted growth zones and their respective δ18O signatures. In three of these examples, the number of counted growth zones is equal to the number of δ18O maxima. Further, the locations of the counted growth zones and the locations of the δ18O maxima in the thin sections are generally similar (Fig. 7). Therefore, this adds confidence to our age validation. In approximately 39% of the specimens, where the counted growth zones were not equal to the number of δ18O maxima, new guidance was provided for correct interpretation of problematic growth zone patterns. For example, we learned that a dark zone sometimes occurs inside the first true annual zone and should not be counted (Fig. 7). Also, a dark zone between the first and second true annual zones often occurs and should not be counted. This is clearly the case in panel 3 of Figure 7 where a dark zone was counted, but did not co-occur with a δ18O maxima. These examples can now be applied to future age estimates in Pacific cod.
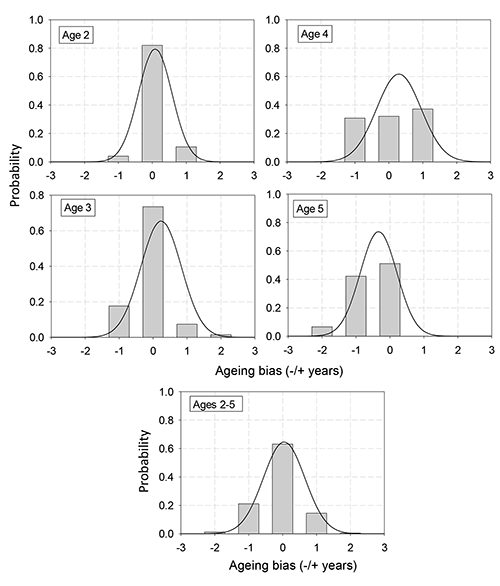
Figure 8. Probability of ageing bias, the difference between the growth zone-based age and true age, at each true age. A positive bias means an age older than the true age was assigned. A negative bias means an age less than the true age was assigned. Bars represent multinomial, solid line represents normal approximation.
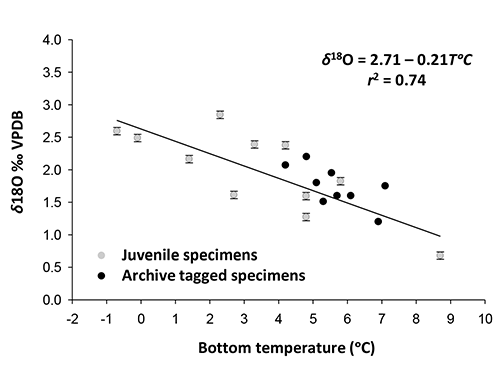
Figure 9. Relationship between water temperature and δ18O in Pacific cod otoliths.
Bias estimation considered the difference between true ages and ages derived from growth zones interpretation in the break-and-bake otolith. It was rare for an age reader to assign an age 2 years greater or less than the true age. Hence, there was a very small probability of bias by that degree (Fig. 8). In general, both the discrete-multinomial and continuous-normal approaches to estimating the probability of bias were similar (Fig. 8). Over all ages, there was a 64% probability that an age reader assigned the true age, with a 19% and 17% probability of assigning an age less or greater than the true age by 1 year, respectively (Fig. 8). The probability of bias at the ages of 2 and 3 years was also relatively symmetric about ±0 years, and the different estimation methods showed similar results. At these ages, there was approximately an 80% probability of assigning the true age, and about a 10% probability of assigning within 1 year of the true age (Fig. 8). At the ages of 4 and 5 years, age specific bias estimates were less symmetric about ±0 years and the different bias estimation methods had more discrepancies. At an age of 4 years with the discrete-multinomial approach, the probability of assigning an age equal to the true age was about 32%, to 1 year greater it was about 37%, and to 1 year less it was about 30%. In contrast, the continuous-normal approach showed a much greater probability (~62%) of assigning an age equal to the true age. Further, in this approach the probabilities of assigning an age 1 year greater or less than the true age were very unequal, about 36% and 8% respectively. At a true age of 5 years, the probabilities differed slightly between the two bias estimation methods. Both methods indicated a 50% to 60% probability of assigning an age equal to the true age. The probabilities in both methods were near 0% of assigning an age greater than the true age. However, the probabilities of assigning an age 1 year less than the true age were about 42% and 30% for the discrete-multinomial and continuous-normal approaches, respectively. Also, the discrete-multinomial approach indicated a small probability of under-ageing true age by 2 years (Fig. 8). While a comparison between the two estimation methods was instructive, we suggest that the discrete-multinomial approach was more faithful to the nature of age data.
The secondary goal of our research, to describe the relationship between otolith δ18O and water temperature, was very successful. The instrumental temperatures we had, whether measured at time of capture or from recording archival tags, demonstrated the strength of the relationship between δ18O in Pacific cod otoliths and water temperature (r2 = 0.74) (Fig. 9). In a related fish species, Atlantic cod (G. morhua), previous studies have also indicated that δ18O is a function of temperature..
The δ18O signatures indicated that the growth zone-based ages were usually correct, i.e. validated. When the number of δ18O maxima was not the same as growth zone-based ages, valuable insights were provided to aid interpretation of the growth zones. The confirmed relationship between otolith δ18O and water temperature lent credibility to this age validation study.
Craig R. Kastelle, Thomas E. Helser, Jennifer McKay, Delsa M. Anderl