
AFSC News
May 20, 2015
Maps from the 1930s Help Find Potential Fish Habitat in the Digital Age
 |
| |
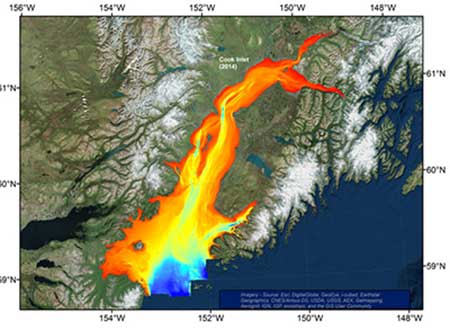
A total of 1.4 million National Ocean Service (NOS) bathymetric soundings from 98 hydrographic surveys represented by smooth sheets in Cook Inlet were corrected, digitized, and assembled in order to produce this interpolated depth surface for Cook Inlet, Alaska. |
For years, researchers, fishermen, and policy makers have had to rely on low-resolution navigational charts with limited fish habitat information to analyze fish habitat in Alaskan waters. But now, with the help of technology, detailed survey data from the 1930s may help to improve fish habitat analysis and help us learn more about important commercial fish stocks.
"We now have a much more detailed picture of the seafloor in some areas," said Mark Zimmermann, research fish biologist with NOAA Fisheries' Alaska Fisheries Science Center. "We can see variations in depth between areas and unique features like troughs and banks. We will also be studying how fish and other marine life use these different habitats."
The challenge was to translate the old data that were documented by hand on large flat, one-dimensional sheets of paper called smooth sheets, into a form that would be useful to modern scientists without having to spend millions of dollars.
These smooth sheets exist for many nearshore areas of Alaska. Nearshore areas are important as nurseries for rearing of young fish. Being able to pinpoint where these nursery areas are enables fishery managers to better define and protect essential fish habitat for commercial species of Alaska.
How did the scientists translate the data?
| |
 |
| |
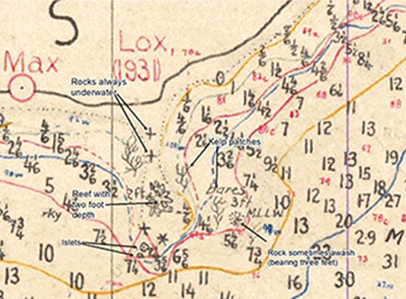
Inshore cartographic features of rocks, reefs, kelp patches and islets from smooth sheet H05152. Depth soundings in fathoms are shown as numbers, some with fractions. |
NOAA Fisheries scientists developed a new methodology to transform the one-dimensional data on the smooth sheets, into three-dimensional digitized layers of data. They used a geographic information system (GIS) to do this.
Smooth sheets provide 10 times as much bathymetry or seafloor depth than traditional nautical charts. They also provide other data such as; shoreline location, seafloor sediment type, and various features such as kelp beds, rocky reefs, and islets.
What can we learn using digitized maps?
Scientists used the digitalized maps to compare five inshore study areas known to be important habitat for juvenile Pacific halibut and flathead sole. They were able to quantify differences and similarities between bottom type and depths at each of the sites to determine, which ones would provide preferred habitats for these fish.
Scientists in the Gulf of Alaska Project sponsored by the North Pacific Research Board (NPRB), are using these same data sets to predict the preferred habitat across the central Gulf of Alaska for juveniles of five other important species: walleye pollock, Pacific cod, Pacific ocean perch, arrowtooth flounder and sablefish. This knowledge could help design more focused research surveys in the future, saving valuable resources.
Smooth sheets are available for free through NOAA's National Geophysical Data Centerr in Boulder, Colorado. For more information on the Alaska Fisheries Science Center's use of smooth sheets and the study of Alaska bathymetry please visit the AFSC website.
|
