
AFSC News
April 6, 2016
Magnuson-Stevens Fishery Conservation and Management Act in Action: How biological surveys support sustainable Alaskan fisheries
You don?t have to sample a lot of area to get good science! Small samples over very large areas produce good science.
This month NOAA Fisheries celebrates the 40th Anniversary of the Magnuson-Stevens Fishery Conservation and Management Act, the federal law that set the U.S. on track to healthy fish stocks and fisheries. Underlying the success of this important U.S. law is a management system supported by good science. Biological surveys make it possible for scientists to provide reliable estimates of how many fish are in the ocean. Sometimes, scientists also get a few surprises, like discovering a new species.
The ABCs of Catch Limits
Abundance data from research surveys, Biological data and Catch data provide the basis of catch limits in U.S. managed fisheries.
Abundance data collected by scientists during regular research surveys and catch data collected by fishermen and fishery observers contribute to our understanding of fish and shellfish populations. This information makes it possible for scientists working with managers to set safe catch limits for U.S. fisheries. Harvesting at these limits leaves enough fish and crab in the water to reproduce, maintain their function in the ecosystem, and provide fish to catch in the future in Alaska.
“We use the long-term data from research surveys and fishermen?s past catch levels to evaluate stock health and set safe catch limits for the future. The better the quality of the data, the more confident we can be that the catch limits we are setting will protect fish stocks and help ensure the success of fishermen and fishing communities.” said Wayne Palsson, a fisheries biologist at the Alaska Fisheries Science Center.
The state of Alaska is vast, and the amount of ocean the Center monitors is equally immense. Center scientists monitor four large marine ecosystems off Alaska—The Arctic (Chukchi and Beaufort Seas), Aleutian Islands, Eastern Bering Sea, and Gulf of Alaska. To better understand how these ecosystems work and maintain healthy fish and shellfish populations scientists conduct research surveys in at least two of the four large marine ecosystems every year.
Research surveys are conducted on chartered fishing boats or NOAA research vessels. They collect samples of plankton, fish and other species using a variety of equipment including plankton nets (for larval fish and shellfish) trawls, hook and line gear and acoustic sound waves (for juvenile and adult fish).
| |
Surveys also give us a window into the spectacular biological diversity in the ocean! During the 2015 survey, 213 species of fish and 535 different kinds of invertebrates from the Gulf of Alaska were identified.
|
Surveys Help Scientists Detect Trends in Fish Population Size
The surveys are an essential part of long-term monitoring programs that help scientists see trends and notice changes in the population dynamics of commercially important species such as walleye pollock, Pacific cod or red king crab. These surveys also provide data for monitoring changes in Alaska ecosystems. In the Gulf of Alaska, the survey spans 1,400 miles, from the eastern Aleutians to Ketchikan, and from nearshore waters to the outer limits of the continental shelf, which can be over 100 miles offshore. It is challenging sampling such a large area in just a few months from May to August.
“We collect a variety of information including species identification, size, condition and more to gauge whether the population is stable, increasing, or declining. By being consistent in the way we collect data, we can make careful comparisons over time,” said Palsson.
Designing efficient and cost-effective surveys to collect data from large areas is a goal of the Center. For example, how do you even begin to sample an area as big as the eastern Bering Sea that is roughly about 70,000 km2 larger than the entire state of California? The solution is simple: you break it down into smaller pieces! Center scientists use the power of statistics to divide large areas, such as the Bering Sea into grids and then they figure out the optimum number of grids that need to be sampled that will provide the best estimate of the number of organisms throughout the entire area. For instance, in the eastern Bering Sea only 0.0035% of the entire continental shelf needs to be sampled. Now that?s efficiency (and math) in action!
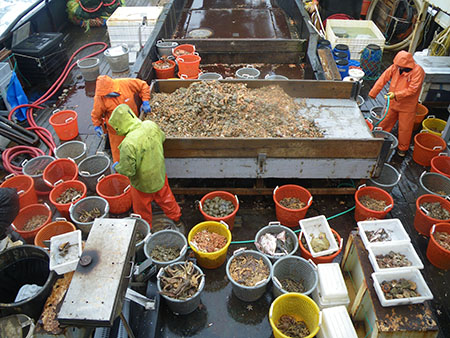 |
| Scientists sort the catch first by species to collect abundance data, and then by sex to collect biological samples. |
What Scientists Do During a Typical Research Survey
Waters in Alaska vary widely in depth, which makes sampling, especially in nearshore areas, quite difficult. To accommodate for these kinds of areas, NOAA often charters fishing vessels that are appropriately equipped to conduct these surveys. These vessels are able to deploy bottom trawl nets specially designed to gather the maximum amount of information during each tow of the net. These nets are fitted with instruments such as thermometers, sonars, and pressure sensors to determine bottom temperature, net fishing performance, and total area fished.
To minimize impacts on seafloor habitat, the net makes contact with only a small fraction of the seafloor. Each tow's duration is short, only 15–30 minutes long, covering a distance of just 1–3 km. Sensitive areas such as rocky habitats are avoided during the surveys.
Once the catch is on board, the organisms are sorted by species, weighed, and counted (see photo). Scientists also collect biological samples; for example, otoliths (ear bones) are collected to determine fish ages, and fish stomachs are collected to examine what fish eat.
NOAA scientists also employ high-tech methods to gain additional information during surveys. Trawl nets fitted with sensitive listening and imaging instruments send sound pulses through the water column to create echoes which are interpreted to estimate the presence and number of various organisms. These echograms can be used to augment the catch data by providing a "snapshot" of the animals that survey nets (see photo) may be capturing.
Echograms can be filtered to ?see? what organisms are in the water column. For example, in the image below, the acoustic data are filtered to focus in only on krill (small shrimp). From left (A) with most backscatter included from other organisms, to right (E) with unwanted backscatter filtered out showing only the krill layer.
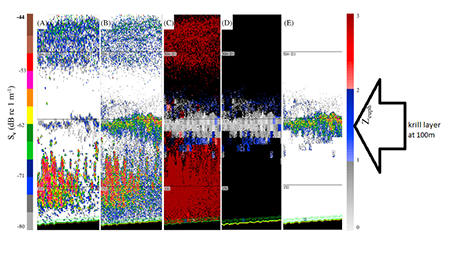 |
| Figure: Echograms can be filtered to ?see? what organisms are in the water column. For example, in the image above, the acoustic data are filtered to focus in only on krill (small shrimp). From left (A) with most backscatter included from other organisms, to right (E) with unwanted backscatter filtered out showing only the krill layer. (Click to Enlarge) |
Data Analysis Back in the Laboratory
Once the survey data and biological samples are collected at sea, another important phase begins. Back on land, the data provide the basis of scientific analyses that tell us more about the condition of Alaska's ecosystems and fish populations. Scientists will learn the age of various commercially important fish (by counting annual rings on the ear bones), how abundant a particular species is, what they eat, and when and where they reproduce. This information helps scientists understand the current state of fish populations, and predict future abundance trends based on impacts from commercial fishing or environmental factors such as climate change. Most importantly, these analyses provide the scientific information used by the North Pacific Fishery Management Council to make responsible management recommendations.
If you see one of these chartered vessels marked with ?U.S. Research? or ?NOAA Research? signs or one of our big white NOAA ships when you are in Alaska this summer, know there are scientists onboard collecting data to ensure that seafood harvested from Alaska waters is sustainable.
Story by: Rebecca Reuter
For more information please contact Marjorie Mooney-Seus,
206-526-4348 (office), 774-392-4865 (cell)
|


